How to Analyse Profit and Loss Reports in Odoo 18 Accounting Module
How to Analyse Company Profit and Loss Reports in Odoo 18 Accounting Module
For business leaders, the Profit and Loss (P&L) statement is a strategic tool, not just a compliance artifact. In Odoo 18, the Accounting module consolidates financial data into a drillable view that supports timely, evidence‑based decisions. This condensed guide provides practical steps to analyze P&L reports, interpret the numbers, and turn insights into actions you can implement today.
Introduction
The P&L reveals how much you earn from core activities and what you spend to generate that revenue. Regular analysis helps you detect margin erosion, assess pricing and volume effects, and decide where to allocate resources. The goal here is to enable quick, confident decisions using Odoo 18’s built‑in reporting capabilities.
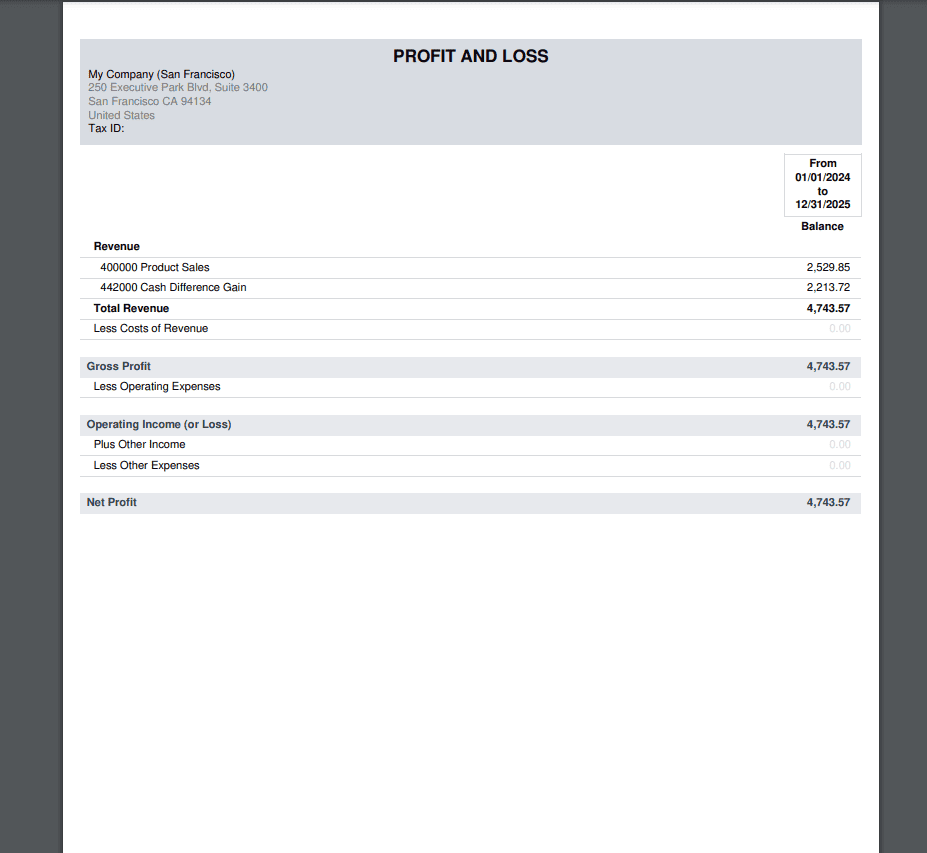
Accessing the Profit and Loss Report in Odoo 18
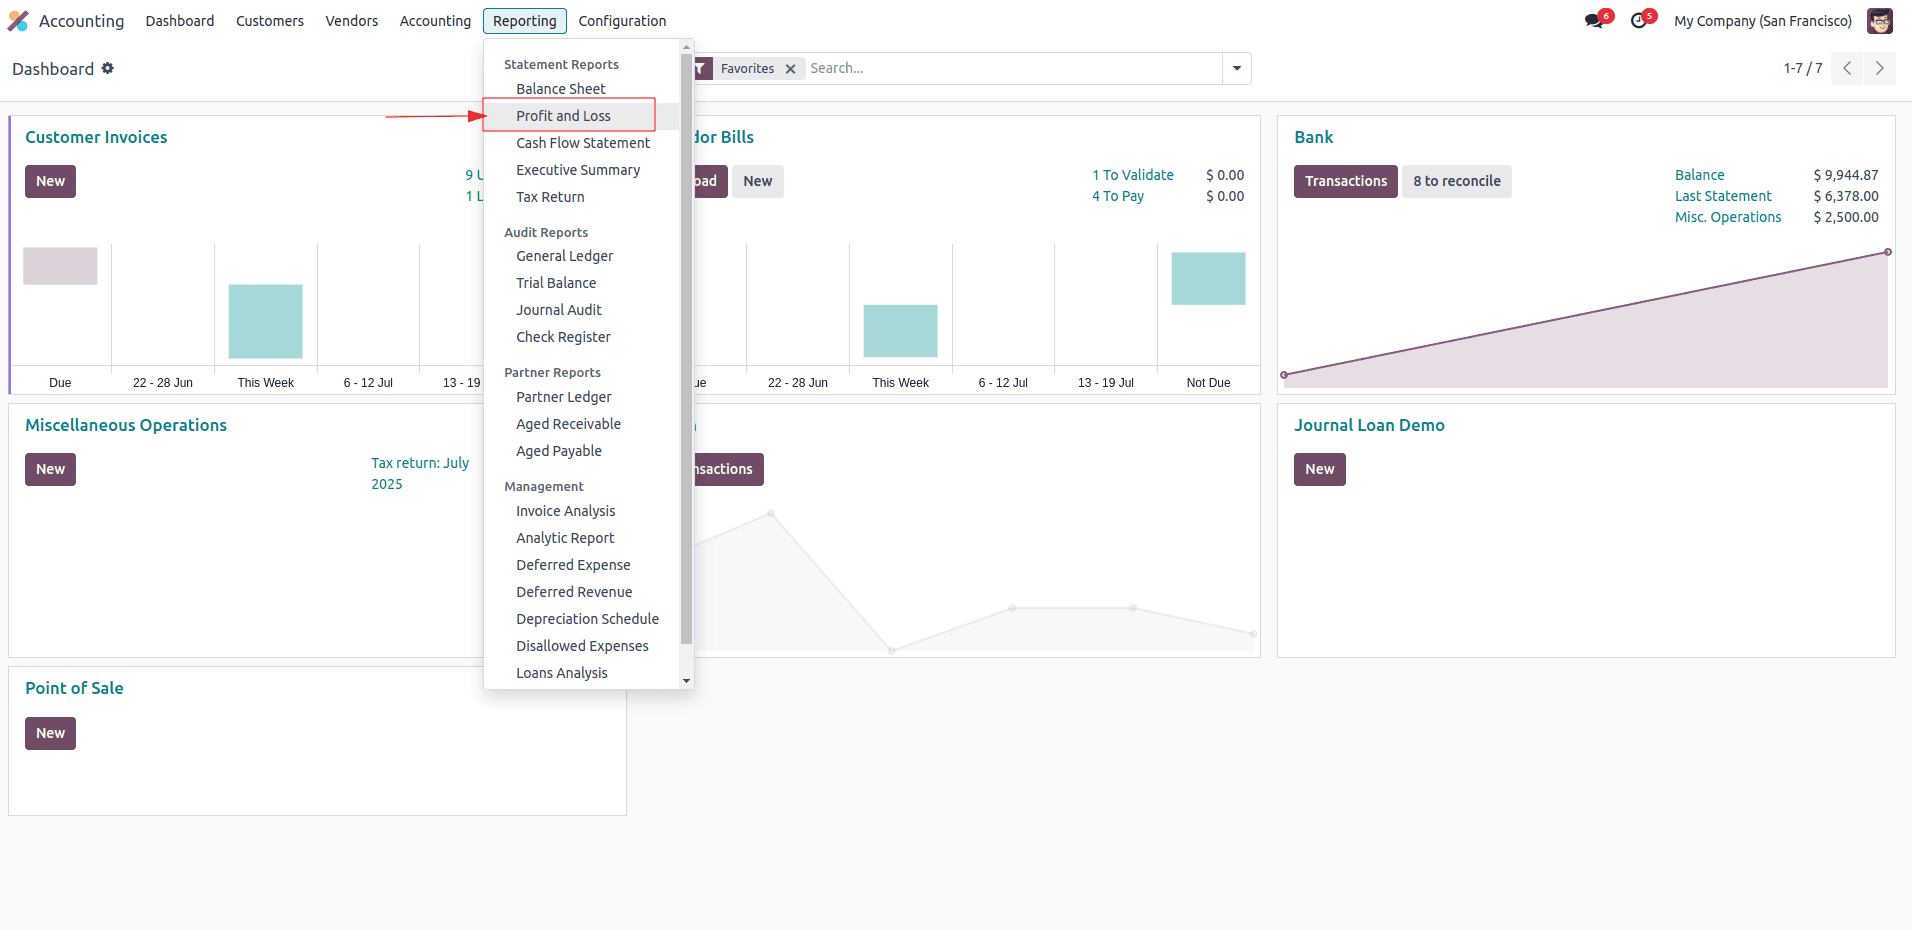
To view and compare periods, start in the Accounting module:
- Open the Accounting module from your dashboard.
- Go to Reports and select Profit and Loss.
- Set your date range (for example 2025-01-01 to 2025-12-31).
- Select the company (if you operate multi-company) and enable Compare to a prior period (e.g., last month or prior year).
- Click Apply to load the P&L with your filters.
Tip: Ensure you have the right access and that your Chart of Accounts is properly configured. Data quality drives meaningful insights.
Key Financial Terms Explained
Familiarize yourself with core terms to translate numbers into action. The main terms in Odoo’s P&L view are:
| Term | Definition | Why it matters |
|---|---|---|
| Revenue | Total income from core business activities before deducting costs. | Represents the top line; trends reveal demand and pricing effectiveness. |
| Cost of Sales (COGS) | Direct costs tied to producing goods or delivering services (materials, direct labor). | Key driver of gross margin; changes affect profitability before operating expenses. |
| Gross Profit | Revenue minus Cost of Sales. | Shows production/service delivery efficiency. |
| Expenses | All operating costs not directly tied to production (salaries, rent, software, marketing). | Major lever for operating efficiency and budgeting discipline. |
| Operating Income | Gross Profit minus Operating Expenses. | Profitability of core operations after expenses. |
| Net Profit | Operating Income plus/minus non-operating items, taxes, and interest. | Bottom line; overall profitability after all costs. |
In Odoo, these terms map to the Chart of Accounts. Align revenue, COGS, and expenses with the correct parent categories for accurate results.
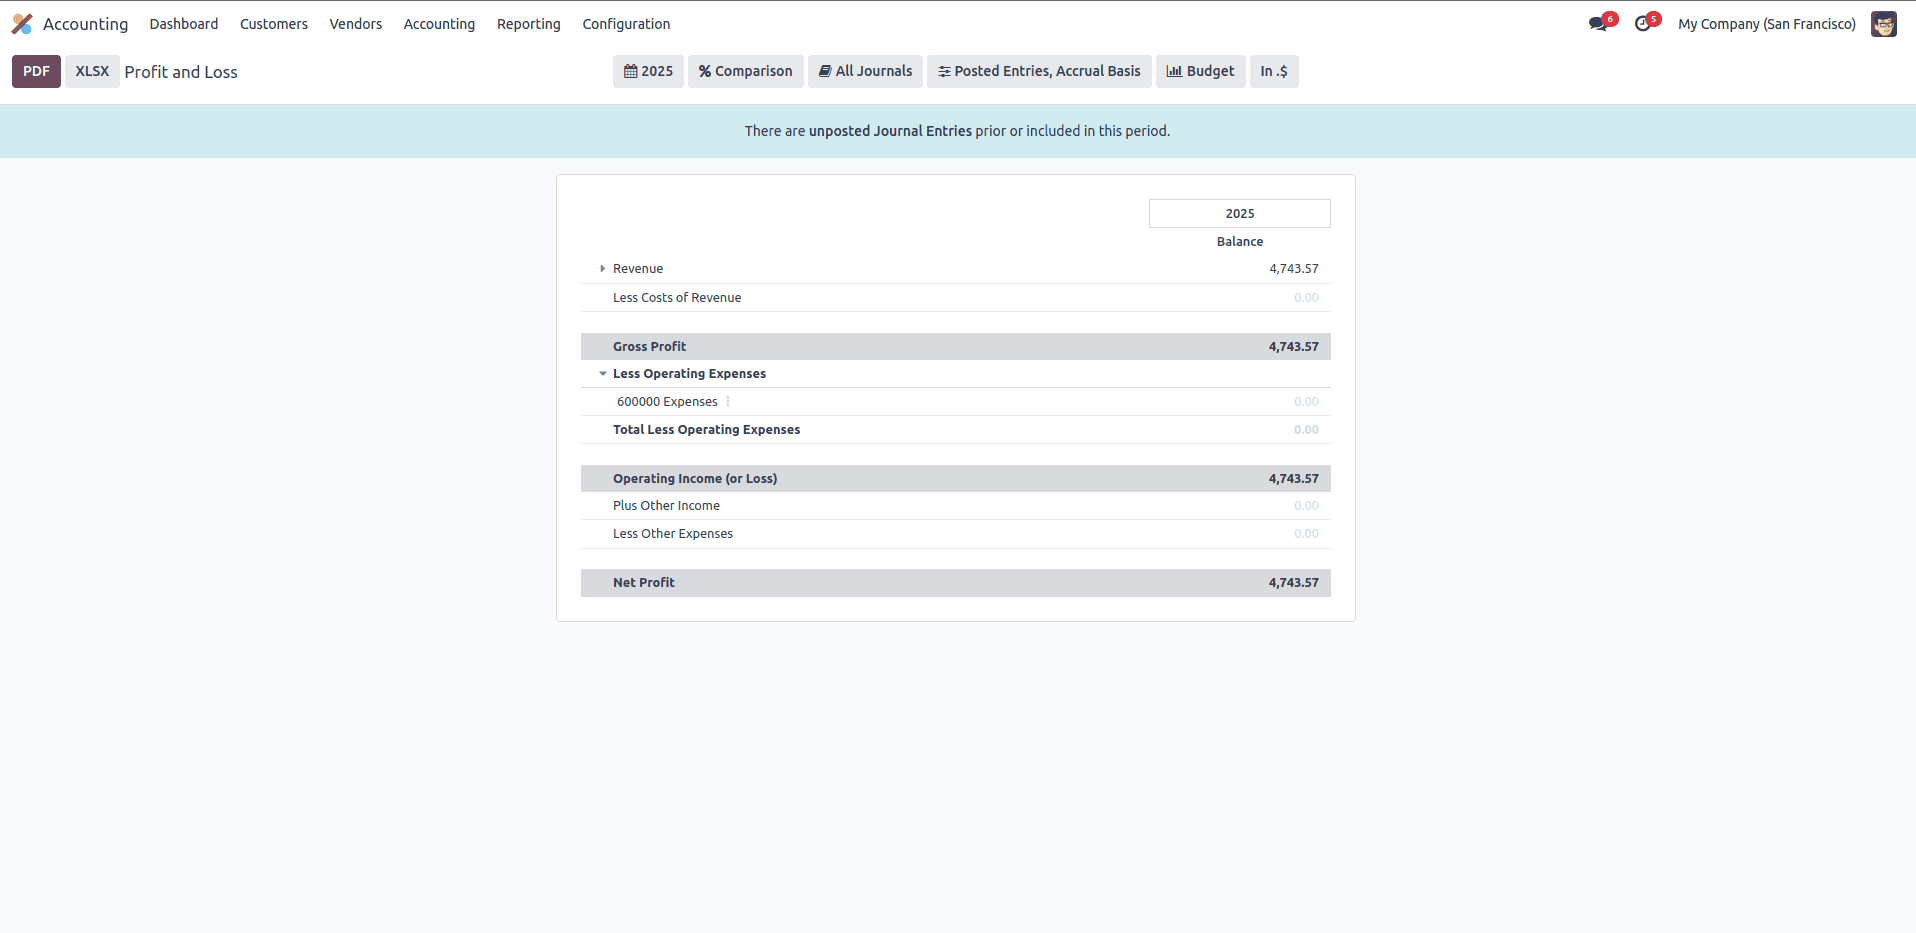
Structure of the Profit and Loss Report
The P&L in Odoo mirrors traditional statements but offers flexible drill-down by account groupings.
- Revenue aggregates income accounts.
- COGS aggregates direct costs tied to revenue.
- Gross Profit shows profitability after direct costs.
- Operating Expenses break out salaries, marketing, IT, facilities, depreciation, and other costs.
- Operating Income shows profitability after operating costs.
- Net Profit is the bottom line after all deductions.
Use parent-child hierarchies to drill down without losing the big picture. Expand a line like “Salaries and Wages” to see sub-accounts such as “Salaries – Engineering” and “Salaries – Sales.”
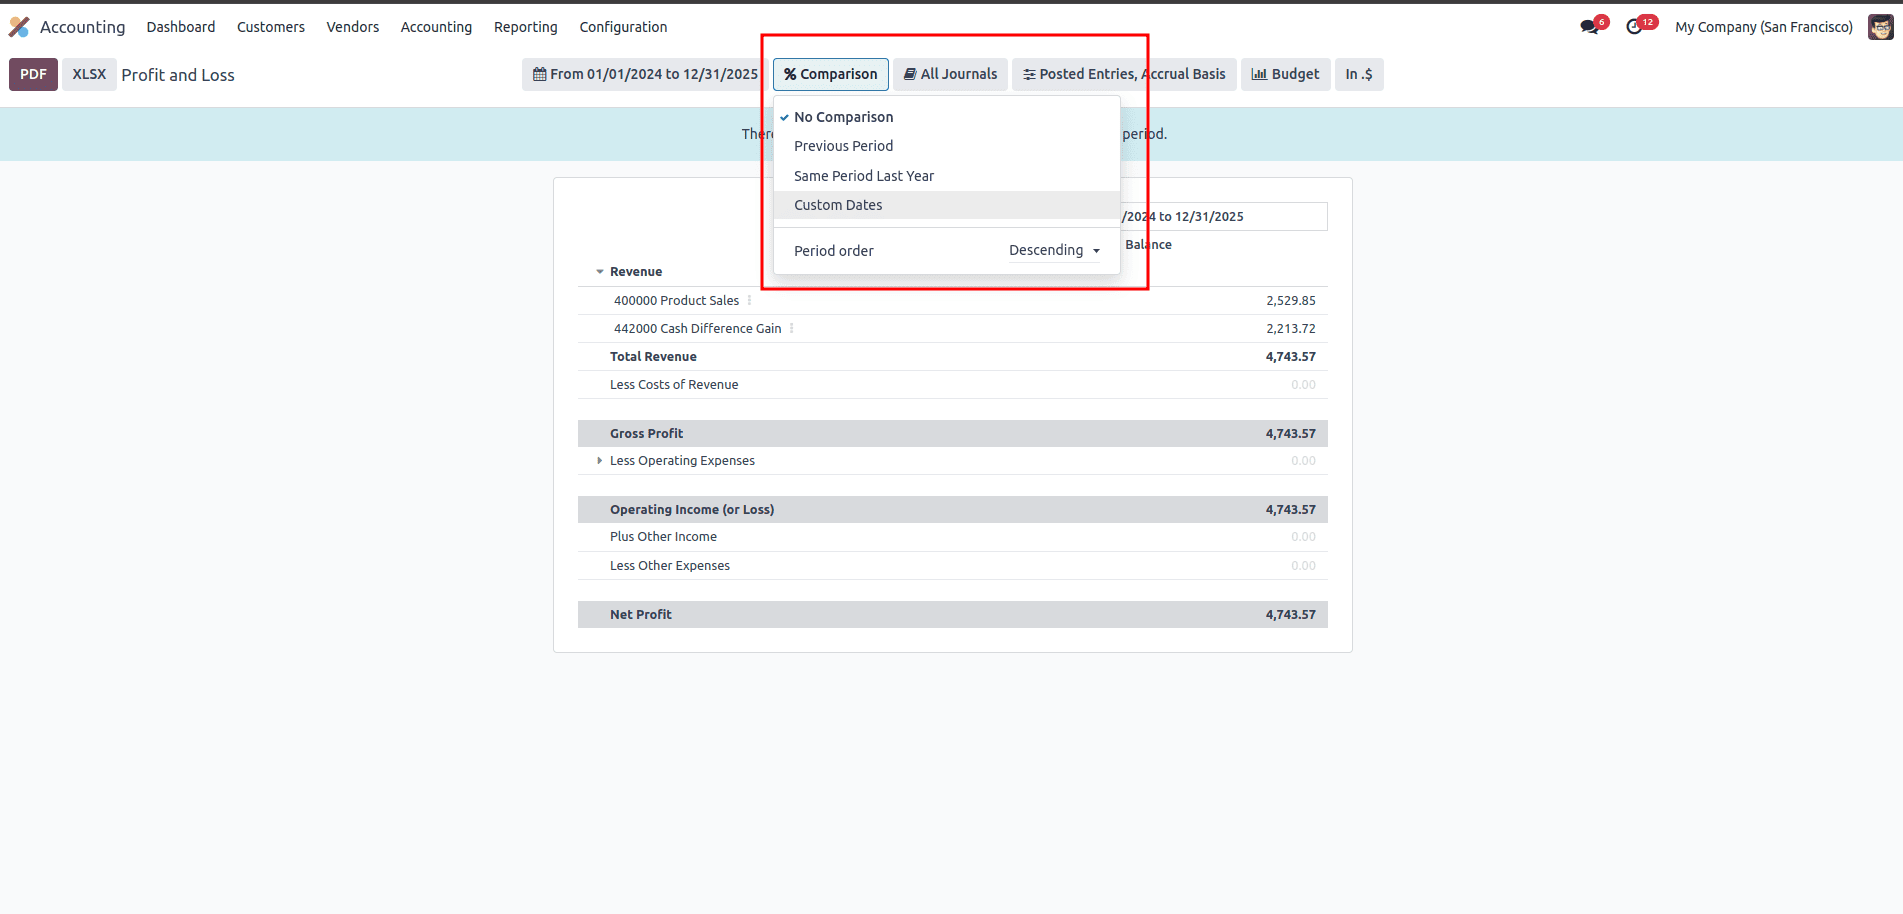
Comparing Time Periods
Period comparisons reveal momentum, seasonality, and anomalies. In Odoo, you can compare the current period with prior intervals to spot shifts in performance.
- Month-over-month compares the current period with the immediate prior month for short-term trends.
- Year-over-year compares the current period to the same period last year for longer patterns.
Enable Compare to when selecting dates to view variances as values or percentages. Focus on root causes - pricing, volume, currency, or one-offs—to guide forecasting and budgeting decisions.
Customization & Filtering Options
The P&L becomes powerful when tailored to your questions. Use filters to isolate insights quickly.
- Date ranges: presets or custom ranges.
- Journals: limit data to specific journals (Sales, Purchases, Banking).
- Analytic Accounts & Tags: filter by department, project, or cost center for multidimensional profitability.
- Grouping: expand/collapse account groups to balance detail with overview.
Tip: Create saved filters or dashboards for management teams to ensure consistency across periods.
Exporting & Sharing Reports
Presenting P&L insights clearly matters. Odoo supports several export formats to suit different audiences.
- PDF for formal reports and records.
- Excel/CSV for deeper analysis or BI tool import.
- Print for quick handouts in meetings.
- Email to distribute directly from Odoo when configured.
Include a concise executive summary and the report scope (currency, company, period) to orient recipients quickly.
Analyze your Profit & Loss in Odoo 18 today!
Drop us a note and we’ll get back to you soon
Configuring Chart of Accounts for Accurate Reports
A robust Chart of Accounts (CoA) is the foundation of reliable P&L insights. A clean CoA ensures consistent grouping of revenues, costs, and expenses across periods and entities.
- Account Types: Use Revenue, COGS, and Expense with meaningful sub-accounts.
- Parent-Child Hierarchies: Build hierarchies to collapse or expand sections without losing data.
- Consistency: Align with budgeting structures to minimize reconciliation work.
Regularly review mappings between operational systems and Odoo accounts. Misaligned mappings distort profitability. A well-maintained CoA reduces effort and improves confidence in reports.
Analytic Accounts & Tags for Deeper Insights
Analytic accounts and tags enable profitability analysis by dimension such as department, project, or cost center. This is especially valuable for project-driven businesses.
- Analytic Accounts: Create accounts for departments, projects, or cost centers and assign them to transactions.
- Tags: Flexible labels (e.g., Marketing, R&D) without changing the CoA.
- Drill-Down: Filter P&L by analytic accounts or tags to reveal unit performance.
Combine CoA structure with analytics for nuanced profitability insights that inform resource allocation and performance reviews.
Multi-Company & Multi-Currency Analysis
Global operations require cross-entity and currency awareness. Odoo 18 supports multi-company reporting and multi-currency scenarios for consolidated views or entity-level checks.
- Multi-Company: Compare results across entities and ensure intercompany transactions are reconciled.
- Multi-Currency: Assess currency effects on revenues, expenses, and net profit; use consolidation/revaluation as needed.
Standardize exchange rates and account for currency gains/losses to keep the P&L meaningful for regional decision-makers.
Automating Report Scheduling & Emails
Automation reduces manual work and ensures timely access to insights. Odoo supports scheduled P&L delivery to executives and teams.
- Scheduled Actions: Run P&L reports at set intervals (monthly, quarterly) and deliver via email or cloud storage.
- Email Templates: Build standardized summaries with attachments and commentary.
- Distribution Lists: Define recipients to ensure the right people receive the right data.
This cadence minimizes delays and keeps leadership aligned with a consistent reporting rhythm.
Key Performance Indicators (KPIs) to Track
Focus on a compact set of profitability and efficiency metrics. Use targets aligned with your business model and industry norms.
| KPI | Formula | What it tells you |
|---|---|---|
| Gross Margin | (Revenue - COGS) / Revenue | Profitability after direct costs; informs pricing and cost control. |
| Operating Margin | Operating Income / Revenue | Efficiency of core operations after operating costs. |
| Net Profit Margin | Net Profit / Revenue | Overall profitability after all costs. |
| EBITDA | Operating Income + Depreciation & Amortization | Cash-based profitability indicator used by financiers. |
Review target ranges regularly and connect variances to actions such as pricing changes, procurement renegotiations, or efficiency programs.
Common Mistakes to Avoid
Avoiding common errors makes P&L analysis faster and more reliable. Be vigilant about data quality and reporting discipline.
- Data Entry Errors: Incorrect postings or missing entries distort results.
- Wrong Date Filters: Misaligned periods create misleading comparisons.
- Untidy Reconciliations: Outstanding reconciliations skew balances.
- Ignoring Currency Effects: In multi-currency setups, exchange rates can misstate performance.
- Over-filtering: Too narrow filters may hide trends; balance detail with overview.
- Not Aligning with Budgets: Compare actuals to budgets to spot gaps and adjust forecasts.
Getting Started: How Encode IO Can Help
Encode IO specializes in ERP optimization and Odoo implementations, delivering data-driven financial reporting that enables faster, more confident decisions. We help you:
- Set up a robust Chart of Accounts aligned with your business model.
- Configure analytic accounts and tags for multidimensional profitability insights.
- Design automated reporting cadences and governance to maintain data quality.
- Provide training for finance teams to sustain improvements.
Track Profit, Grow Your Business with Odoo

Published on 9/26/2025